Single-molecule force spectroscopy experiments allow protein folding and unfolding to be explored using mechanical force. Probably the most informative technique for interpreting the results of these experiments at the structural level makes use of steered molecular dynamics (MD) simulations, which can explicitly model the protein under load. Unfortunately, this technique is computationally expensive for many of the fascinating biological molecules. Here, it was found that normal mode analysis (NMA), a significantly cheaper technique from a computational perspective, allows at least some of the insights provided by MD simulation to be gathered. They apply this technique to three non-homologous proteins that were previously studied by force spectroscopy: T4 lysozyme (T4L), Hsp70 and the glucocorticoid receptor domain (GCR). The NMA results for T4L and Hsp70 are compared with steered MD simulations conducted previously, and it was found that they can recover the main results. For the GCR, which did not undergo MD simulation, their approach identifies substructures that correlate with experimentally identified unfolding intermediates. Overall, we find that NMA can make a valuable addition to the analysis toolkit for the structural analysis of single-molecule force experiments on proteins. The study was published in Nanomaterials (IF 5.076) (Bauer J, Žoldák G. Interpretation of Single-Molecule Force Experiments on Proteins Using Normal Mode Analysis. Nanomaterials. 2021; 11(11):2795.)

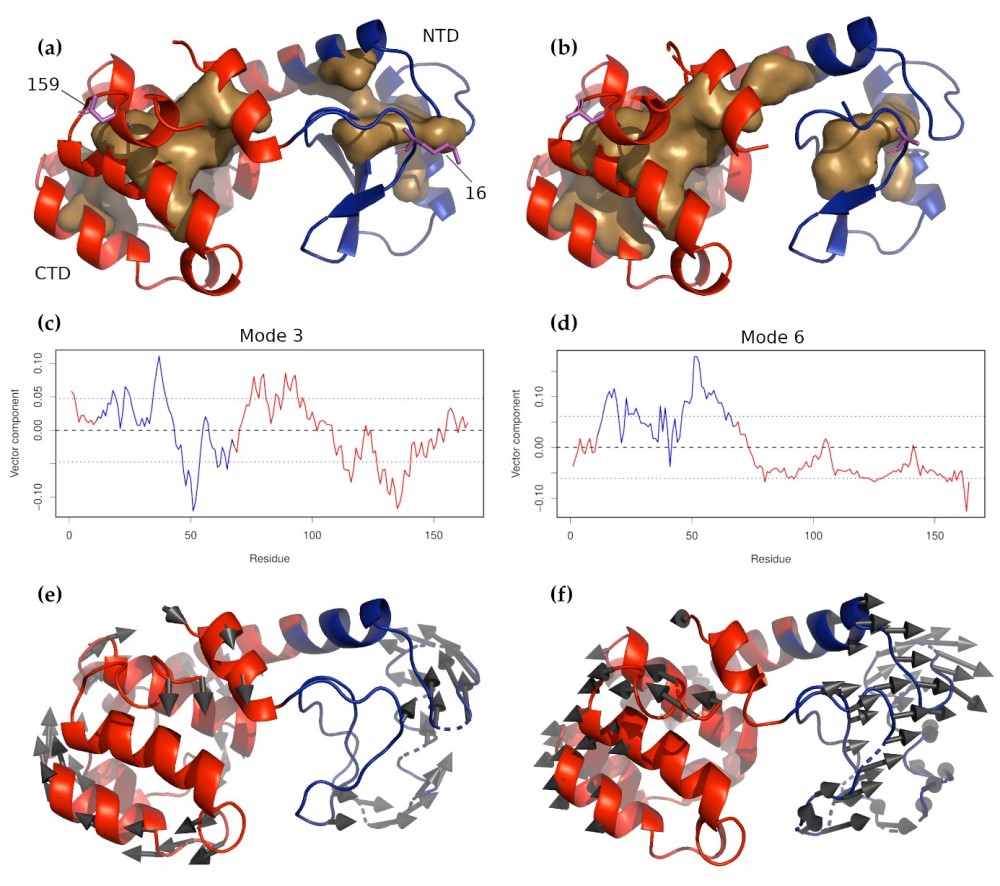
Figure: T4 Lysozyme and circularly permuted mutant CP13. (a) Wild-type T4 lysozyme and (b) CP13. In both pan-els, the N-terminal domain is colored blue, and the C-terminal domain is red. The buried cores of each domain are indicated by the light brown surfaces. Residues 16 and 159, where the molecule was tethered for the force experiments, are shown in magenta sticks. The z-components of non-zero normal modes 3 and 6 for wild-type T4 are shown in panels (c) and (d), respectively, with the residues corresponding to the NTD and CTD colored as in panels (a) and (b). The dashed line near 0.00 indicates the mean displacement. It can be seen, especially for mode 6, that the two domains move in opposite directions in these modes, meaning that they are likely to be amplified by the applied force. The characteristic motions of these two modes are shown in panels (e) and (f) below their respective z-component plots (mode 3 in (e) and mode 6 in (f).


